6 MB/s on a 100 MB/s I/O allocation
A 43 MB ZIP took 10 to 20 seconds. CPU stayed low. IOPS stayed low. Four directional tests isolated persistent writes. Hostinger later confirmed that the account resource limits had to be reapplied.
The application kept getting blamed. The filesystem test kept pointing lower.
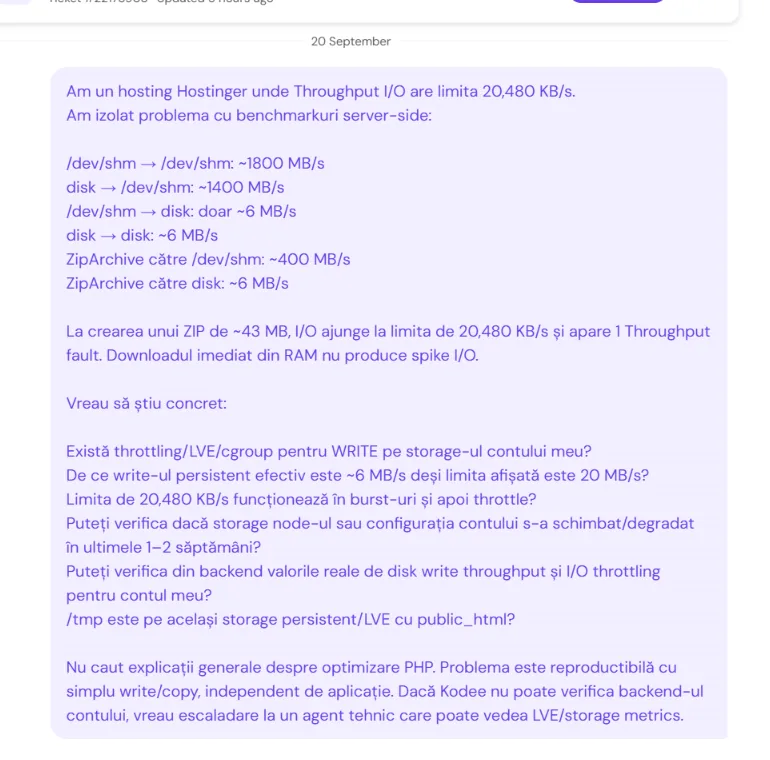
The original symptom appeared while creating ZIP backups in a PHP file manager. That made the application an obvious suspect. The investigation moved below the application layer and measured the same 16 MB payload across four source and destination combinations.
Both paths that ended on persistent storage settled near 6 MB/s. Both paths that ended in RAM were hundreds or thousands of MB/s. A raw copy reproduced the behavior without ZipArchive, directory scanning, browser traffic or download code.
On September 22, Hostinger sent a written resolution stating that the problem had been identified and resolved on its side and that the correct account resource limits were reapplied at 07:36 UTC.
The four-way isolation test
Same server, same process family, same payload size. Only the source and destination storage class changed.
The destination explains the split. A persistent destination stayed near 6 MB/s whether the source lived on disk or in RAM.
ZipArchive cross-check
The same pattern appeared with ZIP STORE. Compression was removed from the equation, leaving file reads, ZIP container work and destination writes.
| Path | Wall time | Source rate | CPU / wall |
|---|---|---|---|
| ZipArchive STORE: disk -> disk | 2.637 s | 6.067 MB/s | 0.0218 |
| ZipArchive STORE: disk -> RAM | 0.039 s | 410.541 MB/s | 0.9966 |
| ZipArchive STORE: RAM -> disk | 2.629 s | 6.087 MB/s | 0.0219 |
| ZipArchive STORE: RAM -> RAM | 0.035 s | 457.875 MB/s | 0.9970 |
Changing the ZIP backend would not remove the persistent write cost. The raw copy result already reproduced the same wall-time class.
The process was waiting, not computing
The slow 16 MB copy to persistent storage used about 2.61 seconds of wall time while PHP consumed about 0.016 seconds of CPU. The CPU to wall ratio was about 0.006. RAM to RAM ran with a ratio near 1.0.
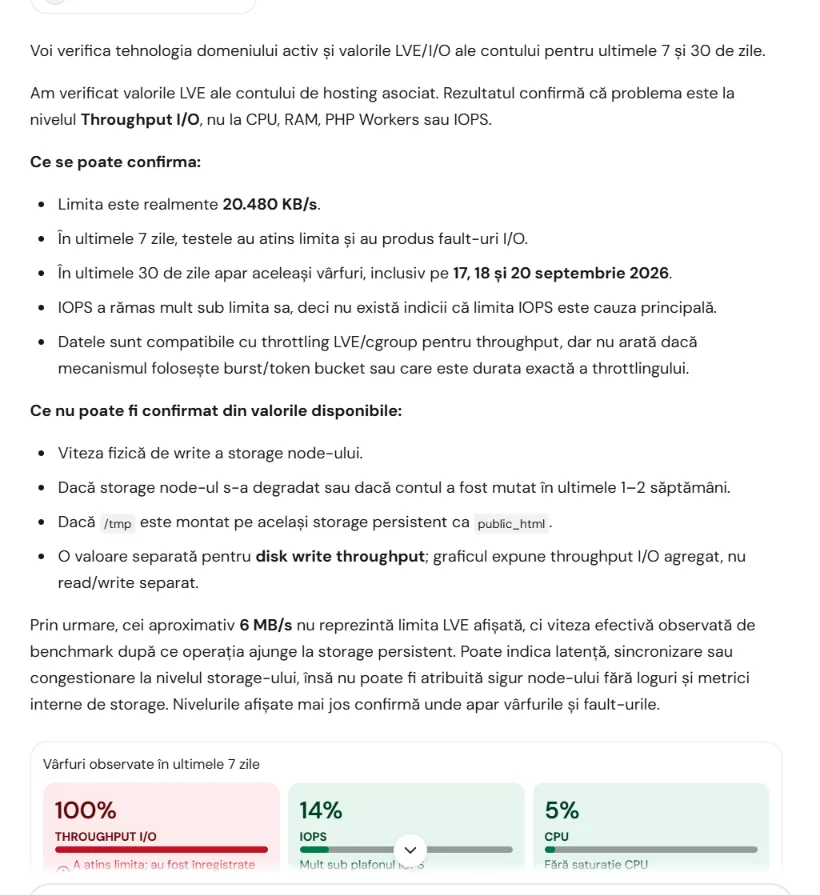
That gap matters. It shows a process spending nearly all of its elapsed time outside CPU work. Hostinger also reported 100% Throughput I/O at the same time that IOPS was about 14% and CPU about 5%.
What the measurements ruled out
Browser and local network
The bottleneck reproduced inside the hosting account with filesystem copy operations. No client transfer was required.
ZipArchive itself
Raw copy and ZipArchive STORE both landed around 6 MB/s when the destination was persistent storage.
Directory scanning
A full metadata scan of the tree completed in about 33 ms. ZIP registration was also measured in milliseconds. The long wait appeared during destination write and close.
IOPS and CPU saturation
Hostinger reported roughly 14% IOPS and 5% CPU while Throughput I/O reached 100% and recorded faults.
Support chronology
Benchmark submitted with exact directional results
The request explicitly asked for storage, LVE and backend investigation and stated that raw copy reproduced the issue independently of PHP application logic.
Hostinger confirmed the resource pattern
The support interface reported the Throughput I/O limit at 20,480 KB/s, repeated I/O faults, low IOPS and low CPU. It also said the available metrics were compatible with throughput throttling.
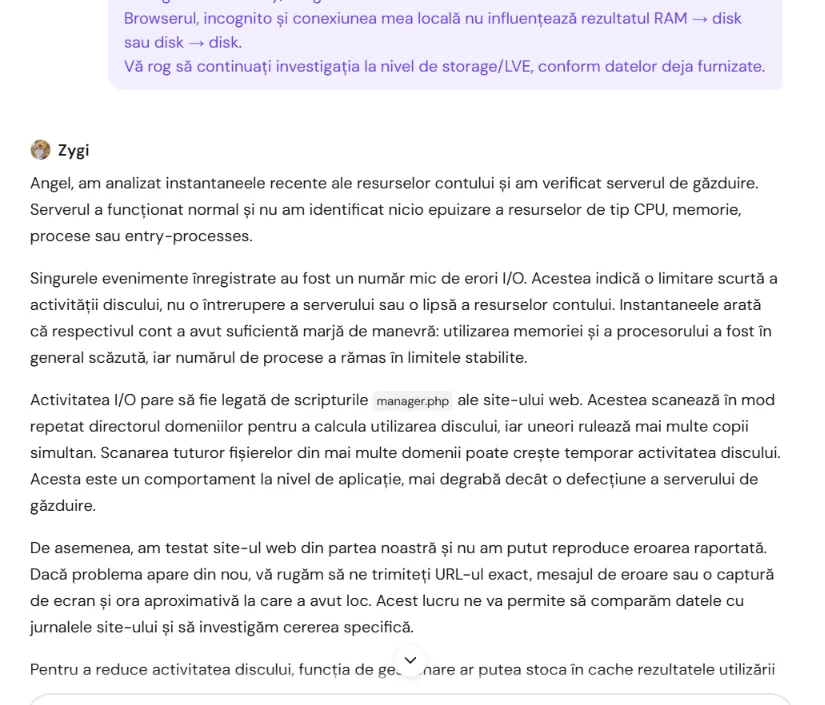
The response shifted back to manager.php
Support suggested repeated directory scanning in manager.php as the likely source of I/O activity and said the site itself tested normally. That explanation did not address the raw copy benchmark.
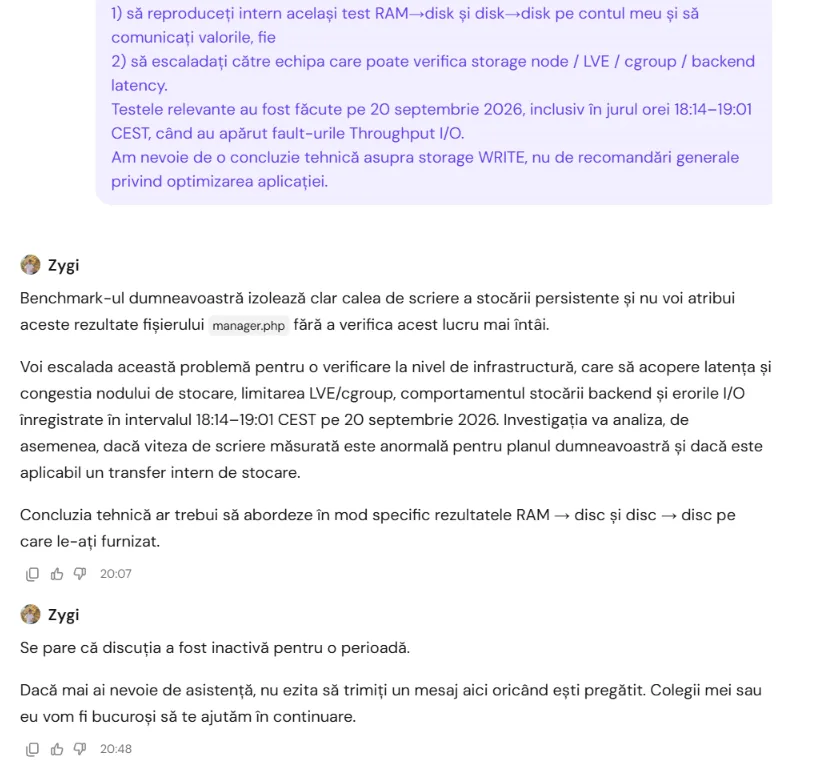
The benchmark was restated and the case was escalated
After the four paths were restated, the agent acknowledged that the benchmark isolated persistent storage writes and said the case would be escalated for infrastructure review.
Hostinger reapplied the account limits
The final update said the issue had been completely identified and resolved on Hostinger's side. The team reapplied the correct resource limits and stated that the account was restored to 100 MB/s I/O, 5,120 IOPS, 4.5 GB RAM and 300% CPU.
The engineering cost of diagnosing the wrong layer
Once raw filesystem copy reproduced the bottleneck, continued attribution to directory scanning sent investigation time back into a layer the measurements had already separated from the failure. That meant more instrumentation, more defensive application changes, more regression checks and more support follow-up before infrastructure review.
A support explanation carries operational cost when engineers act on it. The minimum technical standard is simple: the explanation must account for the measured path. If a 16 MB RAM-to-disk copy spends 2.61 seconds waiting while RAM-to-RAM finishes in milliseconds, an application-scanning theory has to explain that split before it can be treated as a diagnosis.
Public evidence record
The screenshots below are cropped to the relevant exchange. Account identifiers and unrelated support history are removed from the public copy. The originals remain in the private evidence archive.
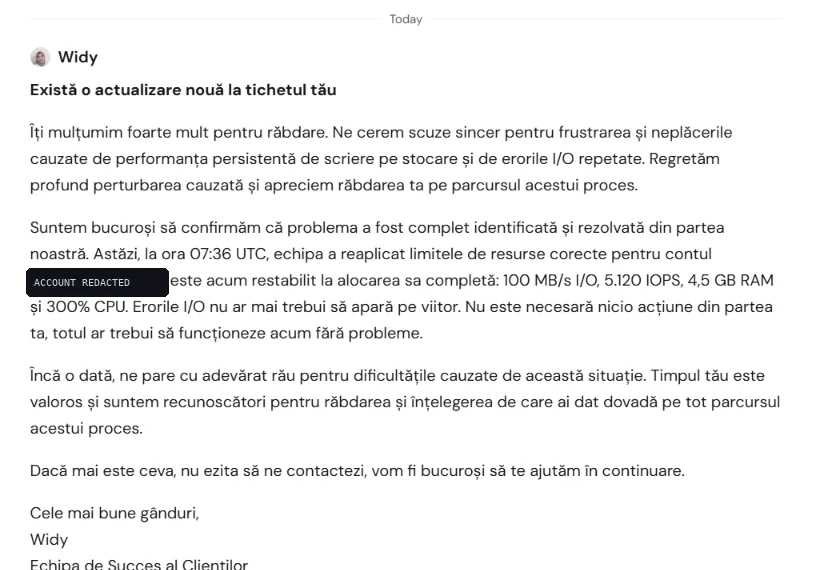
The provider-side correction
Hostinger wrote that the problem was completely identified and resolved on its side, and that the team had reapplied the correct resource limits.
The same message listed the restored allocation as 100 MB/s I/O, 5,120 IOPS, 4.5 GB RAM and 300% CPU. The earlier hPanel view had shown a 20,480 KB/s Throughput I/O ceiling and recorded I/O faults during the test window.
That sequence changes the diagnosis. Application changes made during the investigation may still be useful optimizations, but they cannot explain an account-level resource limit that the provider later says it had to reapply.
Verification status at publication
On 22 September 2026 at 19:07 UTC, the same 16 MB directional test was rerun after Hostinger reported the correction. Persistent destinations completed dramatically faster than the 20 September baseline. The synchronized RAM to persistent write completed at 678.311 MB/s.
The same 16 MB payload, before and after
This panel does not run a server benchmark. It replays the published measurements in the browser so the split is visible: two persistent destinations stalled near 6 MB/s before the correction, then the same code paths completed dramatically faster after it.
Visual replay based only on the published measurements. No filesystem access, no live probe, no shell command, no API call and no network request are triggered by this component. The numeric times are the measured completion times; very fast paths can finish within a single display frame.
These are short 16 MB application-level completion rates. Page cache and buffered I/O can make them exceed a plan resource ceiling, so the meaningful result is the before and after change on the same code paths. The synchronized RAM to persistent variant also completed at 678.311 MB/s.
Technical notes for reviewers
Why /dev/shm mattered
/dev/shm was a separate tmpfs device. Linux documents tmpfs as memory-backed storage. That gave the test a practical RAM destination without changing PHP or the application protocol.
What the 1427 MB/s path actually measured
The persistent to RAM number is cache-sensitive and should not be read as raw device throughput. Its value here is comparative: under the same test, persistent reads completed quickly while persistent destinations repeatedly stalled.
Why the hPanel spike and the 6 MB/s average can coexist
Hostinger documents its graph as aggregated throughput between disk and RAM and marks brief limit hits separately from the overall average. CloudLinux documents LVE I/O limits as throughput caps that throttle processes when the limit is reached.
Why IOPS did not explain this case
Throughput measures bytes per second. IOPS measures operations per second. The support metrics showed the throughput ceiling being hit while IOPS remained far below its own ceiling.
Primary technical references
- Hostinger: How to check resource usage
- CloudLinux: LVE limits and I/O throttling
- Linux kernel: tmpfs and /dev/shm
What I will keep from this incident
A support explanation has to fit the measurements. When it does not, move one layer lower and reduce the reproduction until only the disputed subsystem remains.
The decisive step here was boring on purpose: one payload, four directions, raw copy, fixed size, server-side timing. That small matrix did more diagnostic work than another round of application rewrites.
Preserve timestamps, raw results and provider replies. The final correction becomes meaningful because the earlier measurements and explanations remain visible beside it.